Geometric Brownian motion with Java
The Wiener process is a continuous-time stochastic process named in honor of Norbert Wiener. It’s commonly used to represent noise or financial development with a random component.
The geometric brownian motion can be calculated to visualize certain bounds (in quantiles) to hint about the absolute range.
For calculation following parameters are required:
µ (mu): mean percentage
σ (sigma): variance
t: time period
v: Initial value
The extension to the regular calculation uses: m: Value increase per time period (in my case monthly value) breaks: Quantile breaks to calculate the bounds
Code to calculate the values:
Applying the values:
mu: 0.05 (or 5%)
sigma: 0.1 (or 10%)
initial value: 7000
monthly increase: 100
time period: 6 years
results in the following chart:
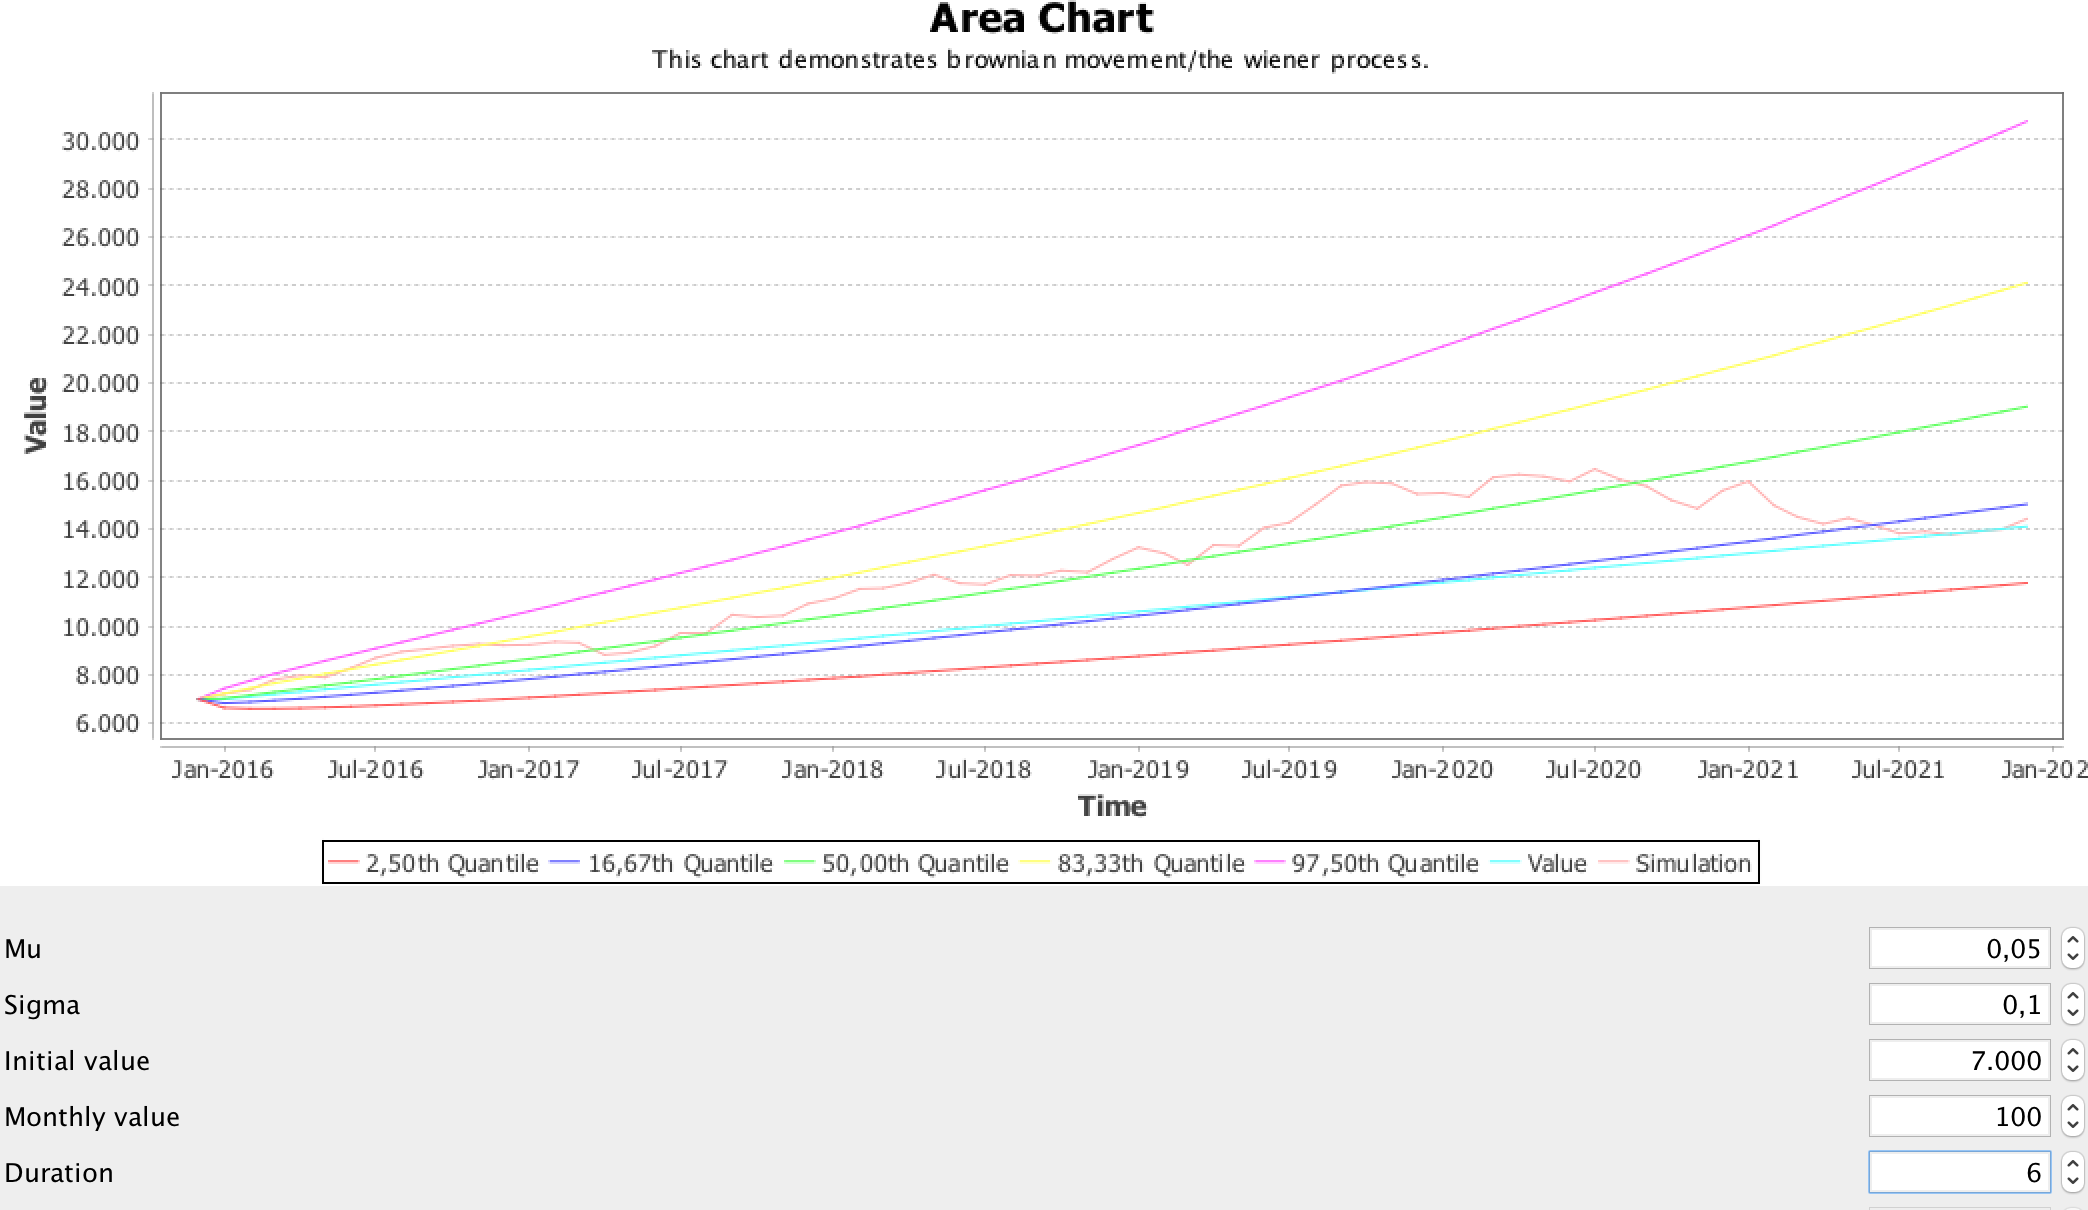
The code is available from Github. It ships with a Swing GUI to enter values and to draw a chart based on the calculation. https://gist.github.com/mp911de/464c1e0e2d19dfc904a7
Related information