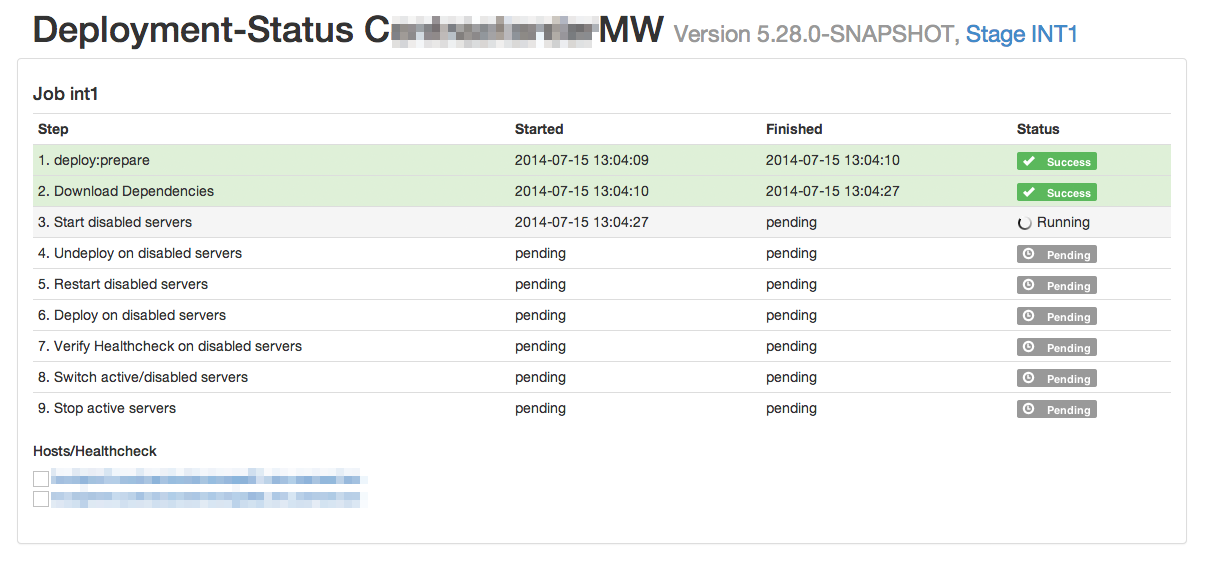
Automated deployments are the state of the art. Incorporating with a deployment pipeline you get the maximum available for now. But what happens in your deployment? Do you know the progress when it’s running? I want to tell you, how I’ve used Capistrano, Bootstrap and MongoDB to visualize the deployment progress with the deployment dashboard.
Capistrano is a ruby tooling to enable deployment (with parallelizing deplyoment) on multiple hosts. You create a recipe with tasks (similar to Ant scripts) and run it against multiple hosts. Capistrano is built on top of Rake which provides task definition, dependencies and execution. All tasks are defined in a model. This allows an external orchestration. You can define Capistrano tasks as usual and invoke them in a way you need it.
I’ve picked the approach to report all states (Capistrano begin/end, task begin/end) to a small application called the deployment dashboard. Every Capistrano deployment script is capable of doing so. Everyone who triggers a deployment can monitor the status. The environment consists JBossAS 7 and Tomcat servers.
Every deployment consists of:
- getting the right artifact
- start/stop of the server
- upload and removal of old artifacts
- load balancer switching
It takes between 2 and 4 minutes for the full deployment.
The deployment sessions register itself once they are started. This updates the dashboard in realtime and displays the steps within the deployment.
After the deployment we retain the sessions which ran and we have a full documentation about the deployment history. We see what was deployed and we can obtain the current deployed version. Sure, a Jenkins has as well a history, but it’s not that comfortable.


