How healthy is my app?
Everyone, who ever deployed a server-based application came for sure to the point: Is my app up and running? Do i have any problems? Sure, you can perform extensive tests - in case you're a good one, you might have a smoke-tests. More or less automated. Server-app deployments are always tricky because of that. Apps having a frontend can be smoke-tested rather quickly and that's ok for deployment-time. Middleware systems, without a frontend make it difficult to smoke-test.
Manual smoke-tests, and even automated are sort of odd. You have to know, how it works, perhaps even setup the test in your environment and finally run it. That's much longer and much more complex than a health check page.
Basic idea of a health check page (let's concentrate on apps running/providing some HTTP services, it's easier to explain it that way) is to provide all useful information at one sight. The name of the application, some version and build information and the most interesting part is the current state of the application. Such pages are generated by the application itself, the smoke test is somehow built in.
Most product owners/product mangers/software architects/requirement engineer don't even know, what they could check. Some developers tend to overload the health check by providing over and over silly things, flooding that page, if any. My experience is: Make the devs and the ops communicate for some 5 to 10 mins, then you can find a very good base to start. In my last projects, we built such health check pages. We provided a middleware system, having only http-based interfaces (REST, SOAP) with a built-in process engine. A smoke test takes there almost 2 minutes, until you know, that certain parts work. Looking in the start up logs is also nice for deployment, but for sure not state of the art. As soon as we got our incidents, nobody had time or the calmness to setup the smoke test and run it. They just wanted to know: What's up. And why. Lucky us. We had a health check, providing us the information, that our database connection pools ran out of connections. We hat this information after just taking a look on the overview.
Build a health check
So, how can we build a health check? Our consists of the following components:
- Index-Page, assembled on build-/packaging time
- Health-Check summary
- extended Health-Check
- Overview-Snippets in our Wiki
That's not much! Using these four components gives you the power, to tell every involved, how the current state is. You can send out the links to other ops, to find out, what's wrong. Or let others find out, that something is out of normal parameters. Let's take a closer look on the health check components.
Index-Page
Every web app should have an index page. Almost all, with a user frontend have it. Middlewares/Backends don't. I really hate it, when I enter the base path of an application and receive a 404 Not Found error. The first impression is: Whoops! Something's screwed up until you realized, that this is normal, operational state. Wouldn't it be nice, if the welcome page really welcomes you? That it says: Hey, I'm this app in version x.y.z, built/deployed on/by. And by the way, that's my current state. I'd love to see such pages. And here's the screen shot of one of our's.
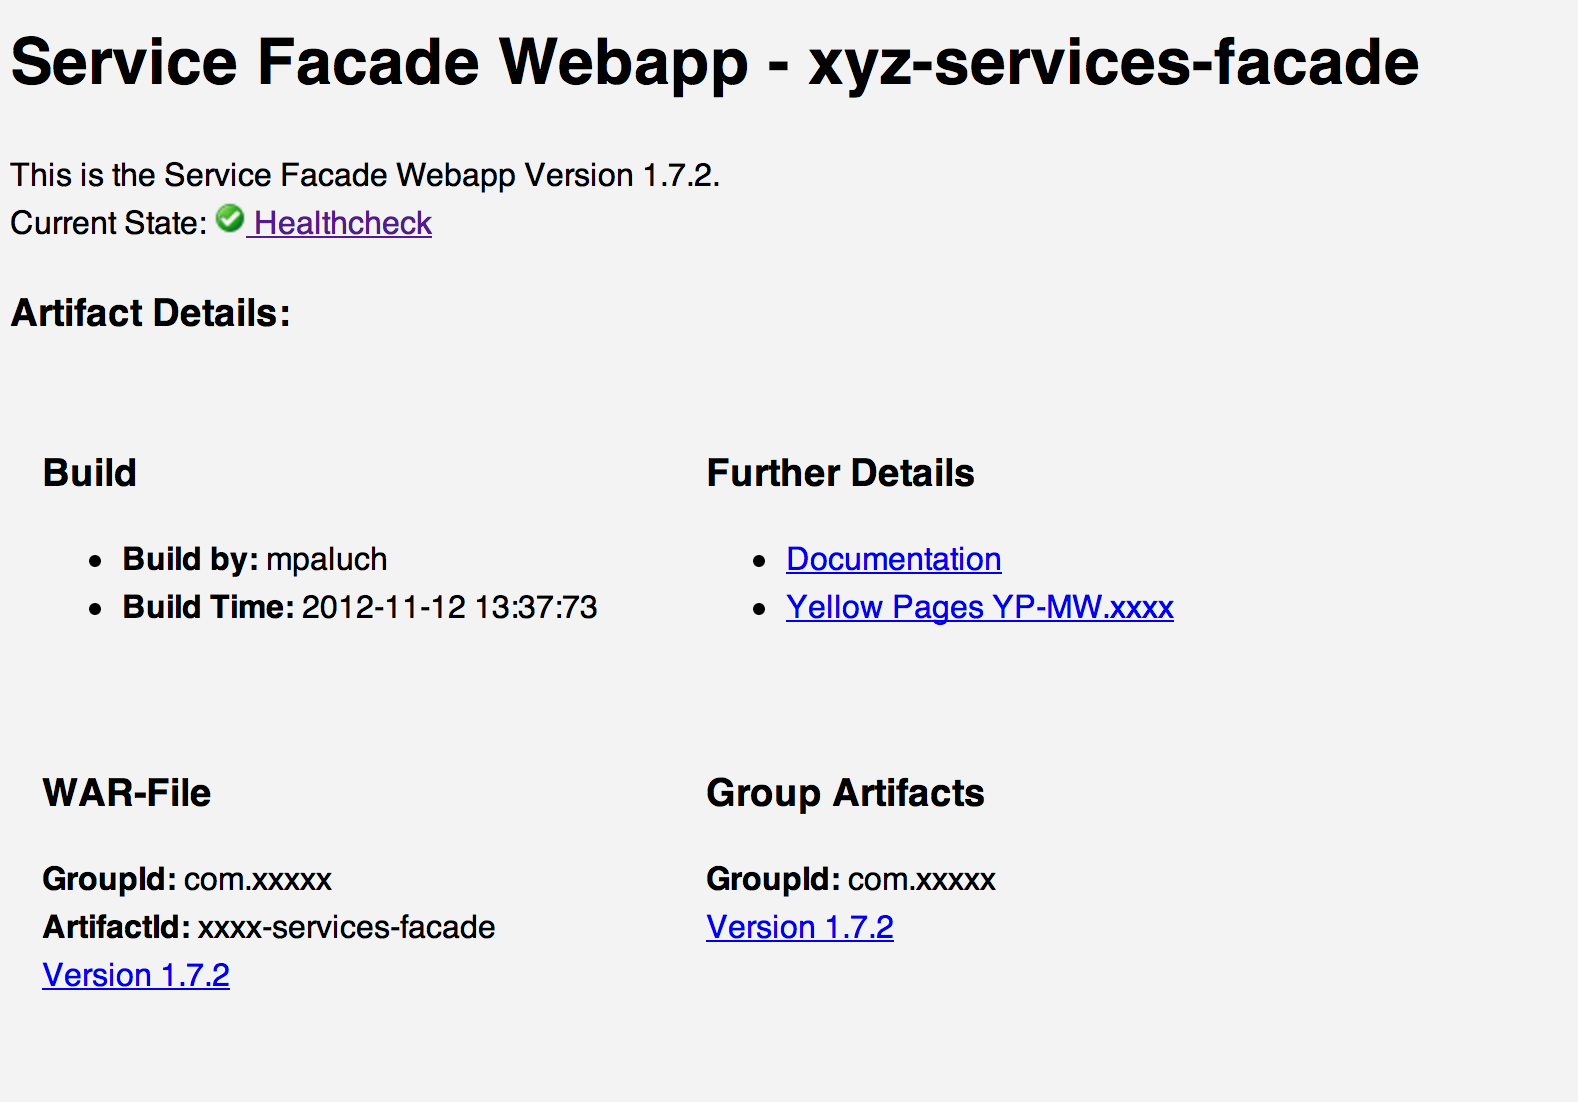
This page states clearly about the current version, when it was built and provides even a link/image to the health check. The page is a simple HTML page. We use currently Maven for building, the page is processed during the build and generated on each packaging process. Since it's automated, no one has to care to update the welcome page.
Health-Check summary
Have you ever ran an application within a cluster? If so, you know, you have a load balancer, that checks, whether your cluster node is contained within the active cluster or not. I've met many clusters, which had a simple foo-bar or "Hello World" web app deployed. They only checked, whether the Tomcat, JBoss or Apache was up & running. But what happens, if your database connection pools run out of connections? Yep, the node is still in the cluster and produces faulty responses.
Why not using also the health check? All of our apps provide a standard health check URL. This URL is then mapped using the JAX WS-RS API/Framework to Java classes, which then provide the functionality. Since I met JAX WS-RS, I love it for HTTP API's and not only RESTful services.
The health check it self checks lots of things. Yet you need something, that is cheap in execution/resources and tells your load balancer, whether you're a good guy or whether it's better not to access the nodes services. We've structured it in two ways: Simple and extended health check.
The simple check executes check, whether the internal services are up and running, whether the connection pool has enough connections (percentage) and whether certain check records can be looked up from the database. The extended health check accesses remote services and runs checks, which need several seconds. Therefore we take only the result of the simple health check for the load balancer. In cases, the application is not deployed, internal structure is screwed up or resources are missing, the node is no longer an active cluster member.
@Path("/healthcheck")
public class HealthCheckResource {

    /**
     * NEWLINE char \n.
     */
    private static final char NEW_LINE = '\n';

    /**
     * @return Detailed Health-Check
     * @throws TechnicalException
     */
    @GET
    @Produces(MediaType.TEXT_PLAIN)
    public String performHealthCheckExtended() throws TechnicalException {
        ...
    }

    /**
     * @return Monitoring-Output in parseable Format.
     * @throws TechnicalException
     */
    @GET
    @Path("summary")
    @Produces(MediaType.TEXT_PLAIN)
    public String performHealthCheckSummary() throws TechnicalException {
        return "OK";
    }

    /**
     * @return Redirect to a Status-Image.
     * @throws TechnicalException
     */
    @GET
    @Path("summary.gif")
    public Response performHealthCheckSummaryImageRedirect(@Context UriInfo uriInfo) throws TechnicalException {
        String imageName = performHealthCheckSummary() + ".gif";
        return Response.seeOther(uriInfo.getBaseUriBuilder().path("../images/" + imageName).build()).build();
    }
}
As soon, as you have a summary, you can do one more cool thing: Use that check as input of an image. So did we. We created also a HTTP URI which creates a redirect, based on the outcome of the health check. This outcome then can be referenced where ever you want to. But let's take first a look on the extended health check.
The extended health check can do way more that the summary. It can perform calls to remote systems, report you some details on execution and replace a hard-to-setup smoke test. Our output looks like that:
SUMMARY: OK -- OK: 41, WARNING: 0, FAILURE: 0
App.Cache: OK
App.Partitions: OK
App.Post-Init: OK
App.Start: OK
App.Websites: OK
Client.AppDescriptorServiceBean: OK -- Avg Duration: 14 ms, Calls: 20, Error Calls: 0, Error Rate 0.0
Client.AppInstanceServiceBean: OK -- Avg Duration: 0 ms, Calls: 0, Error Calls: 0, Error Rate 0.0
Client.AppProvisioningServiceBean: OK -- Avg Duration: 282 ms, Calls: 15, Error Calls: 0, Error Rate 0.0
Client.EventQueueListener: OK -- Avg Duration: 105 ms, Calls: 33, Error Calls: 0, Error Rate 0.0
Client.LoginServiceBean: OK -- Avg Duration: 18 ms, Calls: 17, Error Calls: 0, Error Rate 0.0
Client.PartitionServiceBean: OK -- Avg Duration: 0 ms, Calls: 0, Error Calls: 0, Error Rate 0.0
Client.ProvisioningServiceBean: OK -- Avg Duration: 3044 ms, Calls: 33, Error Calls: 0, Error Rate 0.0
Client.WebComponentServerClientBean: OK -- Avg Duration: 156 ms, Calls: 20, Error Calls: 0, Error Rate 0.0
Client.WebComponentsForWebsiteServiceBean: OK -- Avg Duration: 11 ms, Calls: 410, Error Calls: 0, Error Rate 0.0
Client.WebsiteProvisioningServiceBean: OK -- Avg Duration: 5646 ms, Calls: 17, Error Calls: 0, Error Rate 0.0
Client.WebsiteServiceBean: OK -- Avg Duration: 0 ms, Calls: 0, Error Calls: 0, Error Rate 0.0
Server.Connection-Pool: OK -- Used: 2, Available: 48
Server.Node: OK
Server.System: OK -- hoxyz01.server.lan/1.7.2
It tells us about error rates and the most funny part is the local host name. As soon as you access your application via the load balancer, you usually do not know anything about the backend host. With this health check, you know, where you are :-)
Overview health check pages
Some time, after we created these health checks we found out, that it would be cool, to aggregate that information somehow. No one has over and over the time to check each cluster node. Therefore we used the image redirection to build some nice overviews. We just created some tables on our wiki, which are linked to the health check images and the extended health check. Now take a look on that cool beast of an operators wet dream

That snippet is located in our wiki, right on the deployment and overview pages. Every operator and developer can see the state of all our 9 machines, including a check on the load balancer. The check results are ready after some 500ms. How long would it take you to smoke-test a 9 machines + 2 load balancer environment?