Experimenting with Project Loom EAP and Spring WebMVC
This article walks you through a experiment that uses a Spring Boot application with Virtual Threads. Having access to early access builds is the perfect opportunity to take a look what it takes to use virtual threads as worker threads. With all customizations in place, we issue a few request to verify that our application is running. Finally, we put a bit of load onto the application to see how memory consumption and the number of kernel threads develop over time.
Follow-up post: Carrier Kernel Thread Pinning of Virtual Threads (Project Loom).
Project Loom is in its early stages which don’t allow for exact benchmarking. Instead, the state of the project should be considered to change over time. From the project page:
Early-access (EA) functionality might never make it into a general-availability (GA) release.
EA functionality might be changed or removed at any time.
Involved components:
Spring Framework 5.3 RC1
Spring Boot 2.4 M3
Apache Tomcat 9.0.38
HikariCP 3.4.5
PGJDBC 42.2.16
You can find the code on GitHub at mp911de/spring-boot-virtual-threads-experiment. To run the experiment, you need to use a Loom EAP build (Java 16) and have a Postgres server instance running.
Steps to get this running:
Clone the repository mp911de/spring-boot-virtual-threads-experiment.
Install Loom EAP build (Java 16).
Install Postgres locally or via Docker (
$ docker run --name some-postgres -p 5432:5432 -e POSTGRES_PASSWORD=postgres -d postgres). No special schema required as we’re Postgres for simulation ofselect pg_sleep(1).Build and run this project with Maven (
$ ./mvnw compile spring-boot:run)
You should see an output following something like this:
2020-09-25 12:17:38.108  INFO 13453 --- [           main] c.e.l.ServletOfTheLoomApplication        : Starting ServletOfTheLoomApplication using Java 16-loom on Marks-MBP-2.fritz.box with PID 13453 (/Users/mpaluch/Downloads/loom-servlet/target/classes started by mpaluch in /Users/mpaluch/Downloads/loom-servlet)
2020-09-25 12:17:38.110  INFO 13453 --- [           main] c.e.l.ServletOfTheLoomApplication        : No active profile set, falling back to default profiles: default
VirtualThread: 2 -> OnCondition
2020-09-25 12:17:38.387  INFO 13453 --- [           main] .s.d.r.c.RepositoryConfigurationDelegate : Bootstrapping Spring Data JDBC repositories in DEFAULT mode.
2020-09-25 12:17:38.392  INFO 13453 --- [           main] .s.d.r.c.RepositoryConfigurationDelegate : Finished Spring Data repository scanning in 2 ms. Found 0 JDBC repository interfaces.
2020-09-25 12:17:38.651  INFO 13453 --- [           main] o.s.b.w.embedded.tomcat.TomcatWebServer  : Tomcat initialized with port(s): 8080 (http)
2020-09-25 12:17:38.659  INFO 13453 --- [           main] o.apache.catalina.core.StandardService   : Starting service [Tomcat]
2020-09-25 12:17:38.659  INFO 13453 --- [           main] org.apache.catalina.core.StandardEngine  : Starting Servlet engine: [Apache Tomcat/9.0.38]
2020-09-25 12:17:38.709  INFO 13453 --- [           main] o.a.c.c.C.[Tomcat].[localhost].[/]       : Initializing Spring embedded WebApplicationContext
2020-09-25 12:17:38.710  INFO 13453 --- [           main] w.s.c.ServletWebServerApplicationContext : Root WebApplicationContext: initialization completed in 573 ms
VirtualThread: 3 -> Catalina-utility-1
VirtualThread: 4 -> Catalina-utility-2
VirtualThread: 5 -> container-0
2020-09-25 12:17:38.863  INFO 13453 --- [           main] o.s.s.concurrent.ThreadPoolTaskExecutor  : Initializing ExecutorService 'applicationTaskExecutor'
2020-09-25 12:17:38.982  INFO 13453 --- [           main] com.zaxxer.hikari.HikariDataSource       : HikariPool-1 - Starting...
VirtualThread: 6 -> HikariPool-1 housekeeper-1
2020-09-25 12:17:39.067  INFO 13453 --- [           main] com.zaxxer.hikari.HikariDataSource       : HikariPool-1 - Start completed.
VirtualThread: 7 -> http-nio-8080-BlockPoller
VirtualThread: 8 -> pool-1-thread--1
VirtualThread: 9 -> pool-1-thread--2
VirtualThread: 10 -> pool-1-thread--3
VirtualThread: 11 -> pool-1-thread--4
VirtualThread: 12 -> pool-1-thread--5
VirtualThread: 13 -> pool-1-thread--6
VirtualThread: 14 -> pool-1-thread--7
VirtualThread: 15 -> pool-1-thread--8
The key is to see lines starting with VirtualThread which indicate that virtual threads were created.

The application reacts to two HTTP mappings:
$ curl http://localhost:8080/ -> Returns OK after 1000ms using Thread.sleep(…). This should simulate a blocking call within the JVM.
$ curl http://localhost:8080/sql -> Returns [{pg_sleep=}] after 1000ms using Postgres via JDBC to call select pg_sleep(1). This simulates blocking I/O over the network.
The application reacts to two HTTP mappings:
$ curlhttp://localhost:8080/-> ReturnsOKafter1000msusingThread.sleep(…). This should simulate a blocking call within the JVM.$ curl http://localhost:8080/sql-> Returns[{pg_sleep=}]after1000msusing Postgres via JDBC to callselect pg_sleep(1). This simulates blocking I/O over the network.

Several places create new Threads for various purposes. This experiment controls nearly all thread creations from:
Apache Tomcat (org.apache.tomcat.util.threads.TaskThreadFactory, org.apache.tomcat.util.threads.ThreadPoolExecutor, org.apache.tomcat.util.net.AbstractEndpoint (AcceptorThread), org.apache.tomcat.util.net.NioBlockingSelector.BlockPoller, org.apache.tomcat.util.net.NioEndpoint.Poller)
Spring Boot (org.springframework.boot.autoconfigure.BackgroundPreinitializer, org.springframework.boot.autoconfigure.condition.OnClassCondition.ThreadedOutcomesResolver, org.springframework.boot.web.embedded.tomcat.TomcatWebServer (startDaemonAwaitThread))
HikariCP (com.zaxxer.hikari.util.UtilityElf (ThreadPoolExecutor))
The classes are customized by duplicating their source and applying local customizations. Note that this mechanism works for the given dependency versions and is likely to break when upgrading dependencies. Do not try this at home.
Several places create new Threads for various purposes. This experiment controls nearly all thread creations from:
Apache Tomcat (
org.apache.tomcat.util.threads.TaskThreadFactory,org.apache.tomcat.util.threads.ThreadPoolExecutor,org.apache.tomcat.util.net.AbstractEndpoint(AcceptorThread),org.apache.tomcat.util.net.NioBlockingSelector.BlockPoller,org.apache.tomcat.util.net.NioEndpoint.Poller)Spring Boot (
org.springframework.boot.autoconfigure.BackgroundPreinitializer,org.springframework.boot.autoconfigure.condition.OnClassCondition.ThreadedOutcomesResolver,org.springframework.boot.web.embedded.tomcat.TomcatWebServer(startDaemonAwaitThread))HikariCP (
com.zaxxer.hikari.util.UtilityElf(ThreadPoolExecutor))
The classes are customized by duplicating their source and applying local customizations. Note that this mechanism works for the given dependency versions and is likely to break when upgrading dependencies. Do not try this at home.

The measurement uses wrk (yes, there’s the coordinated omission problem, but for this case it’s something we can live with) for warmup and measurement. There are quite significant differences between using Virtual and Kernel threads.
1000 Virtual Threads
wrk -c 1000 -t 5 -d 10s --latency http://localhost:8080/
Running 10s test @ http://localhost:8080/
  5 threads and 1000 connections
  Thread Stats   Avg      Stdev     Max   +/- Stdev
    Latency     1.01s     2.54ms   1.01s    67.50%
    Req/Sec     4.54      2.39     9.00     38.46%
  Latency Distribution
     50%    1.01s
     75%    1.01s
     90%    1.01s
     99%    1.01s
  130 requests in 10.07s, 14.60KB read
  Socket errors: connect 753, read 276, write 0, timeout 10
Requests/sec:     12.91
Transfer/sec:      1.45KB

Running 10s test @ http://localhost:8080/
  5 threads and 1000 connections
  Thread Stats   Avg      Stdev     Max   +/- Stdev
    Latency     1.00s     2.03ms   1.01s    80.77%
    Req/Sec     2.09      1.77     8.00     65.12%
  Latency Distribution
     50%    1.01s
     75%    1.01s
     90%    1.01s
     99%    1.01s
  131 requests in 10.10s, 14.71KB read
  Socket errors: connect 753, read 155, write 0, timeout 105
Requests/sec:     12.97
Transfer/sec:      1.46KB
RSS: 253 MB
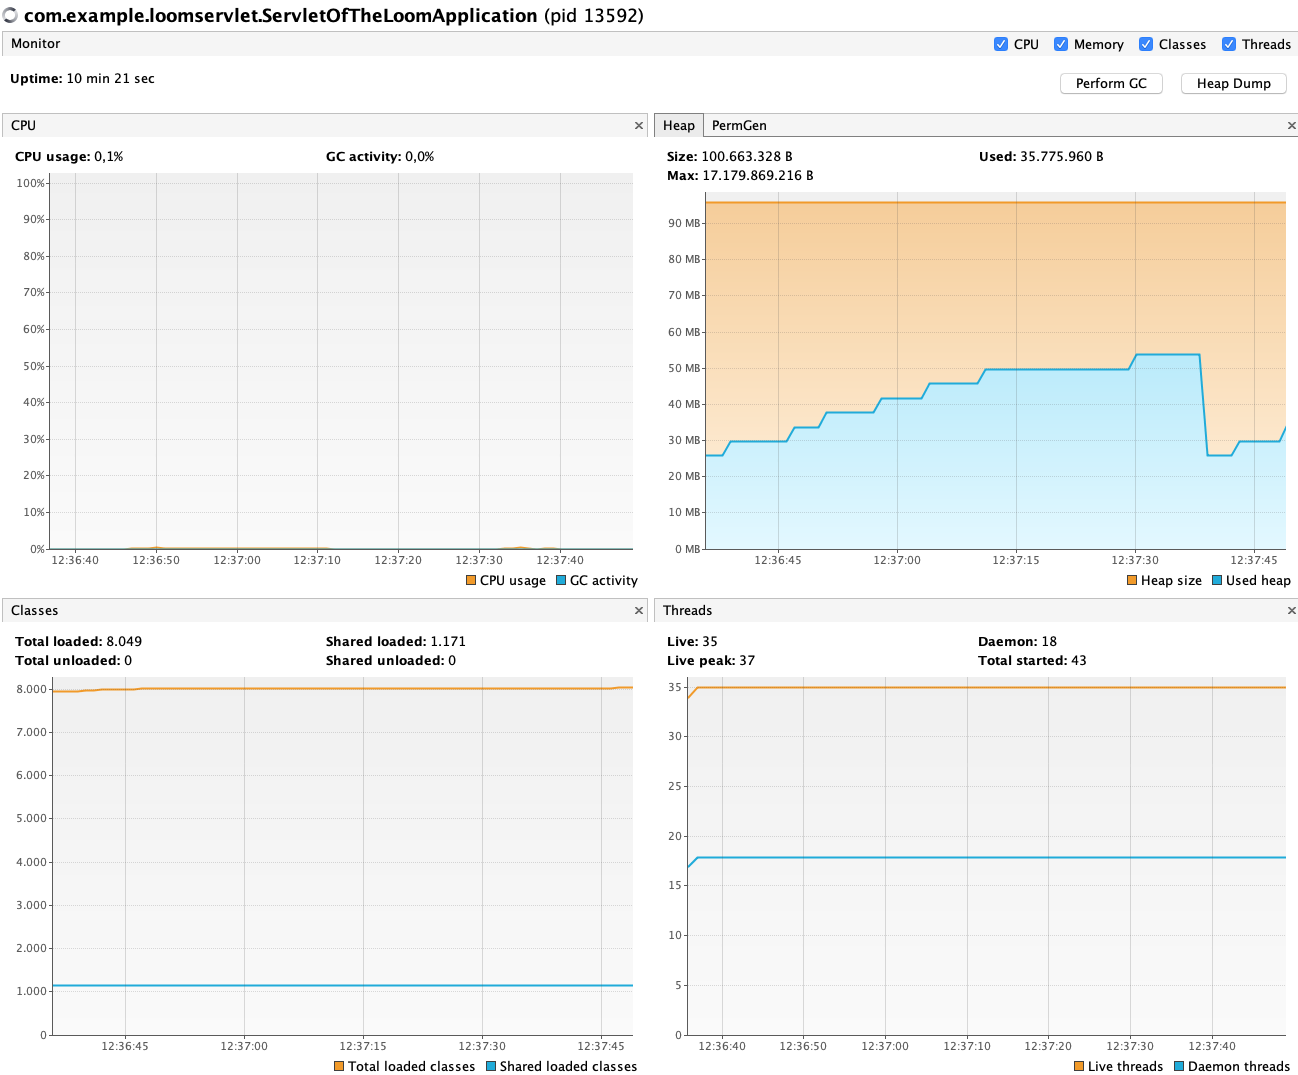 Figure 1. Virtual Threads Overview
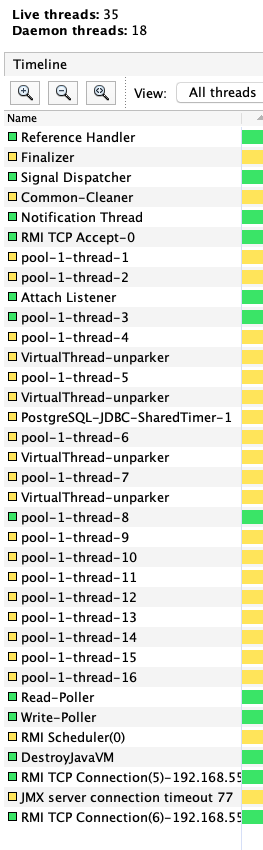 Figure 2. Virtual Threads List
1000 Virtual Threads (default scheduler)
wrk -c 1000 -t 5 -d 10s --latency http://localhost:8080/
Running 10s test @ http://localhost:8080/
  5 threads and 1000 connections
  Thread Stats   Avg      Stdev     Max   +/- Stdev
    Latency     1.03s   100.67ms   1.67s    92.51%
    Req/Sec   103.26     77.81   282.00     54.86%
  Latency Distribution
     50%    1.00s
     75%    1.00s
     90%    1.05s
     99%    1.66s
  2164 requests in 10.07s, 243.03KB read
  Socket errors: connect 753, read 172, write 0, timeout 0
Requests/sec:    214.80
Transfer/sec:     24.12KB

wrk -c 1000 -t 5 -d 10s --latency http://localhost:8080/
Running 10s test @ http://localhost:8080/
  5 threads and 1000 connections
  Thread Stats   Avg      Stdev     Max   +/- Stdev
    Latency     1.00s     5.01ms   1.02s    89.37%
    Req/Sec    69.19    106.09   656.00     94.23%
  Latency Distribution
     50%    1.00s
     75%    1.00s
     90%    1.02s
     99%    1.02s
  2268 requests in 10.10s, 254.71KB read
  Socket errors: connect 753, read 124, write 0, timeout 0
Requests/sec:    224.49
Transfer/sec:     25.21KB
RSS: 375 MB
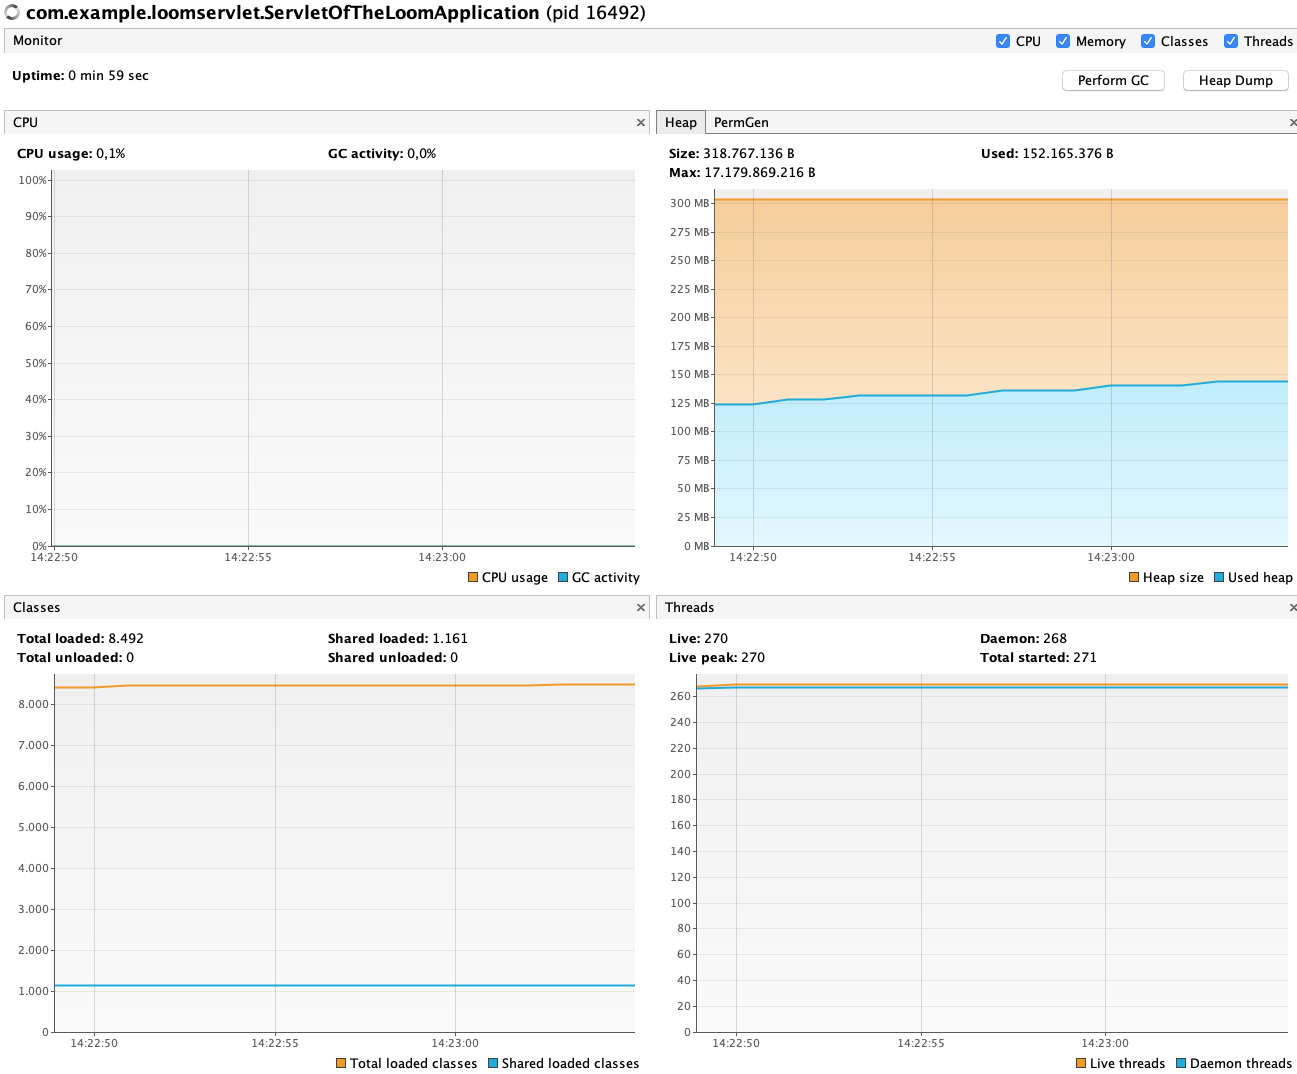 Figure 3. Virtual Threads DefaultCarrierPool Overview
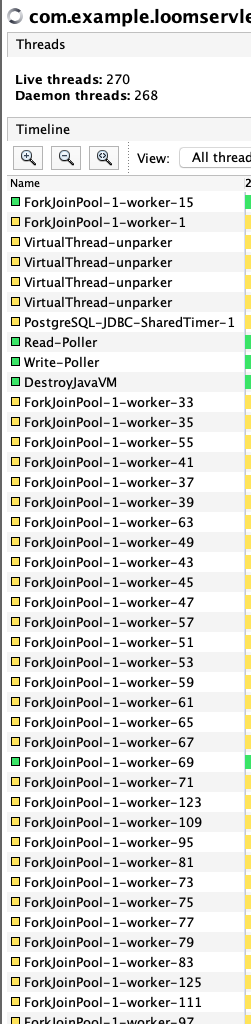 Figure 4. Virtual Threads DefaultCarrierPool List
1000 Kernel Threads
wrk -c 1000 -t 5 -d 10s --latency http://localhost:8080/
Running 10s test @ http://localhost:8080/
  5 threads and 1000 connections
  Thread Stats   Avg      Stdev     Max   +/- Stdev
    Latency     1.03s    65.68ms   1.25s    90.76%
    Req/Sec    45.04     12.29    68.00     68.75%
  Latency Distribution
     50%    1.01s
     75%    1.01s
     90%    1.02s
     99%    1.24s
  2121 requests in 10.06s, 238.20KB read
  Socket errors: connect 753, read 176, write 0, timeout 0
Requests/sec:    210.76
Transfer/sec:     23.67KB

wrk -c 1000 -t 5 -d 10s --latency http://localhost:8080/
Running 10s test @ http://localhost:8080/
  5 threads and 1000 connections
  Thread Stats   Avg      Stdev     Max   +/- Stdev
    Latency     1.01s     2.66ms   1.02s    63.22%
    Req/Sec    83.96    127.34   601.00     89.09%
  Latency Distribution
     50%    1.01s
     75%    1.01s
     90%    1.01s
     99%    1.01s
  2341 requests in 10.09s, 262.91KB read
  Socket errors: connect 753, read 115, write 0, timeout 0
Requests/sec:    232.02
Transfer/sec:     26.06KB
RSS: 356 MB
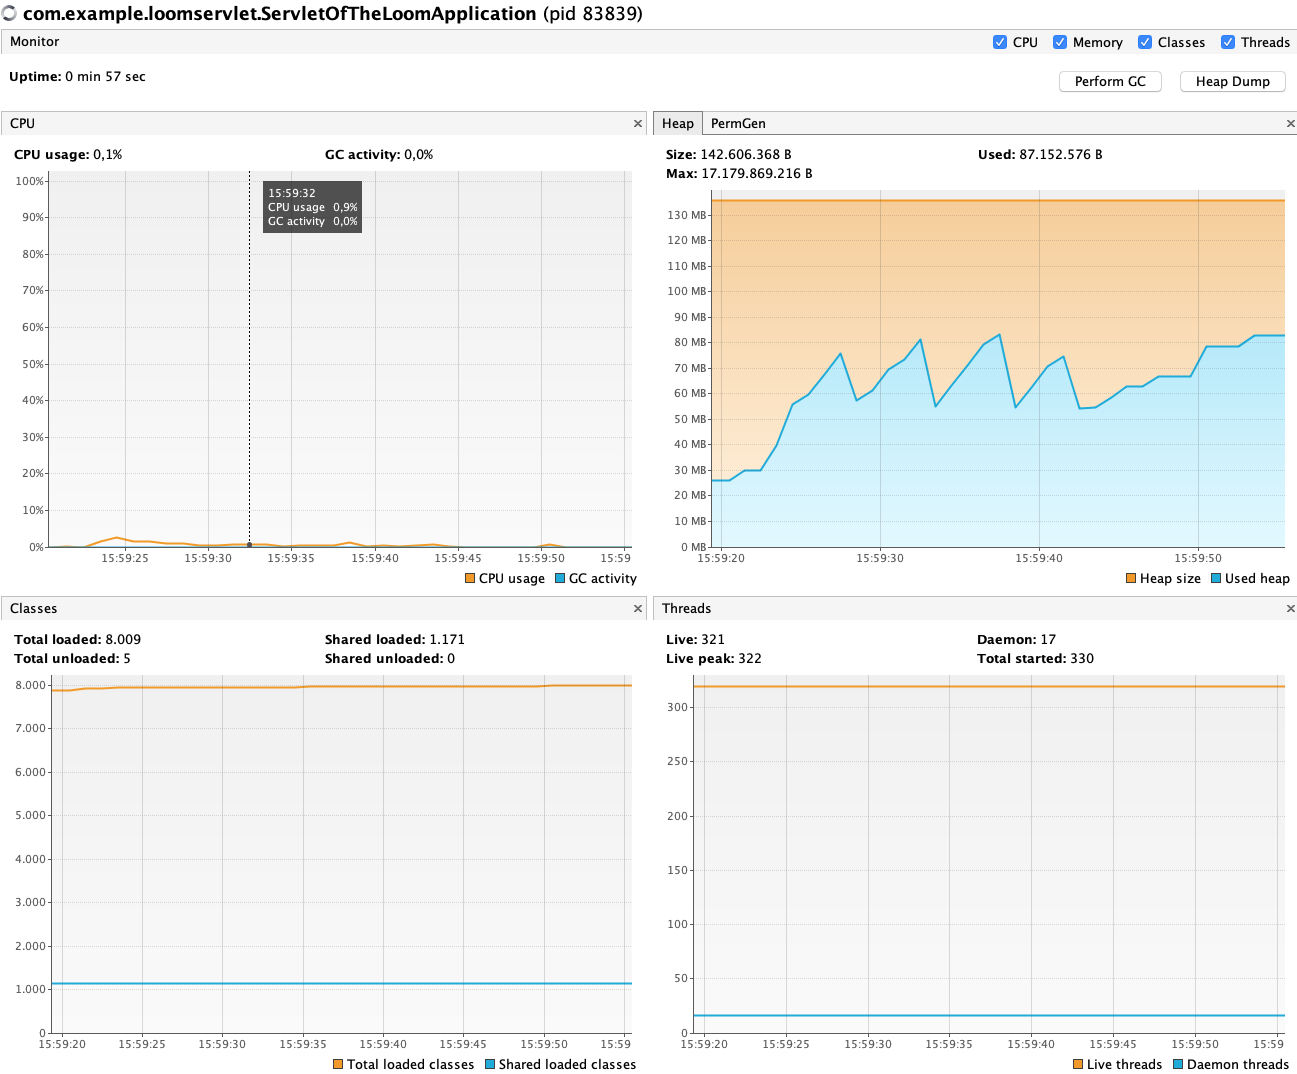 Figure 5. Kernel Threads Overview
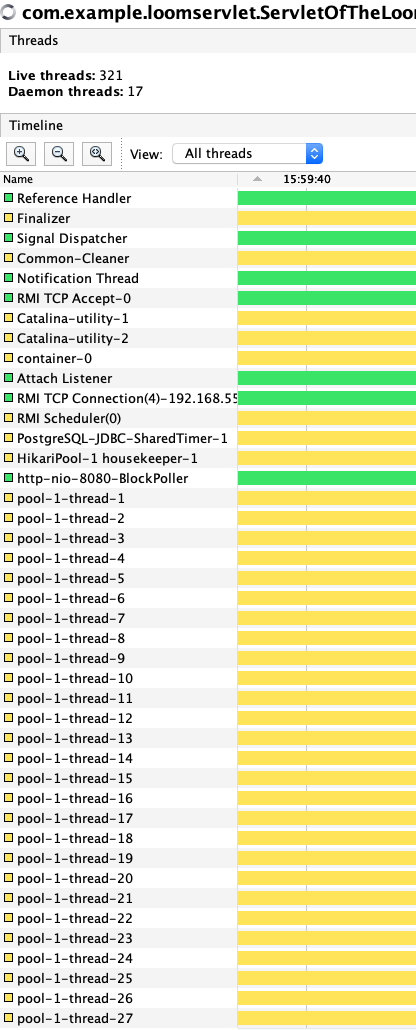 Figure 6. Kernel Threads List
The measurement uses wrk (yes, there’s the coordinated omission problem, but for this case it’s something we can live with) for warmup and measurement. There are quite significant differences between using Virtual and Kernel threads.
1000 Virtual Threads
wrk -c 1000 -t 5 -d 10s --latency http://localhost:8080/
Running 10s test @ http://localhost:8080/
5 threads and 1000 connections
Thread Stats Avg Stdev Max +/- Stdev
Latency 1.01s 2.54ms 1.01s 67.50%
Req/Sec 4.54 2.39 9.00 38.46%
Latency Distribution
50% 1.01s
75% 1.01s
90% 1.01s
99% 1.01s
130 requests in 10.07s, 14.60KB read
Socket errors: connect 753, read 276, write 0, timeout 10
Requests/sec: 12.91
Transfer/sec: 1.45KB
Running 10s test @ http://localhost:8080/
5 threads and 1000 connections
Thread Stats Avg Stdev Max +/- Stdev
Latency 1.00s 2.03ms 1.01s 80.77%
Req/Sec 2.09 1.77 8.00 65.12%
Latency Distribution
50% 1.01s
75% 1.01s
90% 1.01s
99% 1.01s
131 requests in 10.10s, 14.71KB read
Socket errors: connect 753, read 155, write 0, timeout 105
Requests/sec: 12.97
Transfer/sec: 1.46KBRSS: 253 MB
1000 Virtual Threads (default scheduler)
wrk -c 1000 -t 5 -d 10s --latency http://localhost:8080/
Running 10s test @ http://localhost:8080/
5 threads and 1000 connections
Thread Stats Avg Stdev Max +/- Stdev
Latency 1.03s 100.67ms 1.67s 92.51%
Req/Sec 103.26 77.81 282.00 54.86%
Latency Distribution
50% 1.00s
75% 1.00s
90% 1.05s
99% 1.66s
2164 requests in 10.07s, 243.03KB read
Socket errors: connect 753, read 172, write 0, timeout 0
Requests/sec: 214.80
Transfer/sec: 24.12KB
wrk -c 1000 -t 5 -d 10s --latency http://localhost:8080/
Running 10s test @ http://localhost:8080/
5 threads and 1000 connections
Thread Stats Avg Stdev Max +/- Stdev
Latency 1.00s 5.01ms 1.02s 89.37%
Req/Sec 69.19 106.09 656.00 94.23%
Latency Distribution
50% 1.00s
75% 1.00s
90% 1.02s
99% 1.02s
2268 requests in 10.10s, 254.71KB read
Socket errors: connect 753, read 124, write 0, timeout 0
Requests/sec: 224.49
Transfer/sec: 25.21KBRSS: 375 MB
1000 Kernel Threads
wrk -c 1000 -t 5 -d 10s --latency http://localhost:8080/
Running 10s test @ http://localhost:8080/
5 threads and 1000 connections
Thread Stats Avg Stdev Max +/- Stdev
Latency 1.03s 65.68ms 1.25s 90.76%
Req/Sec 45.04 12.29 68.00 68.75%
Latency Distribution
50% 1.01s
75% 1.01s
90% 1.02s
99% 1.24s
2121 requests in 10.06s, 238.20KB read
Socket errors: connect 753, read 176, write 0, timeout 0
Requests/sec: 210.76
Transfer/sec: 23.67KB
wrk -c 1000 -t 5 -d 10s --latency http://localhost:8080/
Running 10s test @ http://localhost:8080/
5 threads and 1000 connections
Thread Stats Avg Stdev Max +/- Stdev
Latency 1.01s 2.66ms 1.02s 63.22%
Req/Sec 83.96 127.34 601.00 89.09%
Latency Distribution
50% 1.01s
75% 1.01s
90% 1.01s
99% 1.01s
2341 requests in 10.09s, 262.91KB read
Socket errors: connect 753, read 115, write 0, timeout 0
Requests/sec: 232.02
Transfer/sec: 26.06KBRSS: 356 MB

It’s surprising to learn how many components create new threads. Virtual threads require less memory than kernel one (253 MB RSS vs 356 MB RSS). Running Tomcat on virtual threads is possible as this experiment shows but something strange happens when putting the application under load.
An interesting observation is the measurement of virtual threads using the default scheduler vs. a dedicated with a fixed size. I assume that is a bug somewhere as the default pool grows with the number of busy virtual threads. Defaults nihilate the benefits that one would expect from virtual threads as both, the number of kernel threads and memory usage are higher than expected. Probably an area for future work.
A more general question arises whether the majority of threads should be virtual ones (e.g. Spring Boot’s background initializer or the condition evaluation, Timer to time out JDBC statements) and how this is supposed to be configured.
It’s surprising to learn how many components create new threads. Virtual threads require less memory than kernel one (253 MB RSS vs 356 MB RSS). Running Tomcat on virtual threads is possible as this experiment shows but something strange happens when putting the application under load.
An interesting observation is the measurement of virtual threads using the default scheduler vs. a dedicated with a fixed size. I assume that is a bug somewhere as the default pool grows with the number of busy virtual threads. Defaults nihilate the benefits that one would expect from virtual threads as both, the number of kernel threads and memory usage are higher than expected. Probably an area for future work.
A more general question arises whether the majority of threads should be virtual ones (e.g. Spring Boot’s background initializer or the condition evaluation, Timer to time out JDBC statements) and how this is supposed to be configured.