Central logging using logstash or Graylog is one of the most interesting topics for now. Software applications get more distributed, are partitioned into different components and are running on multiple servers. This causes the need of central logging. Central logging itself is nice. You don’t have to collect log files from multiple servers anymore. But how do you correlate and track requests on different machines? How can you trace, which request in the frontend caused which error message in the backend?
Until I got to the solution approach, I was searching and trying to guess upon timestamps (yep!) what could have happened. But still log files do not contain enough data. Writing logs into databases is not a solution. Log files, containing lots of additional context data are unreadable. So what now? I started using logstash, where you can push lots of additional context data (MDC – message diagnostics context) and select just the data, you really need (e. g. using the Kibana frontend).
So now you have your logs in one place, but how do you correlate them to one user session or even one request? Let’s collect some pre-requisites:
- You need some HTTP services, let’s say some kind of frontend, a REST and a SOAP WebService
- You need a central logging server, something like logstash
- And you should take a look at https://github.com/mp911de/central-logging-tracking-example
Let’s stick all these pieces together and you’ll get a small system, which is calling itself using SOAP or REST – the recently most used communication types.
As soon as you perform a request to a HTTP service, an individual request id is generated. This request id is passed to all subsequent calls (backends, other services and so on). The backend services have an interceptor, to either generate or use the passed request id. The request id is stored in the MDC and that’s it.
The output will be something like
{
   "_Severity":"INFO",
   "short_message":"executing execute() with message: SOAP 1",
   "_requestUri":"\/ws\/SampleWebService",
   "_requestMethod":"POST",
   "_Tracking.RootSessionId":"none",
   "_Tracking.RootRequestId":"dxkrew4fasdft32x.9VYI",
   ...
   "_App.Version":"2.1 Build 1234"
}
That JSON data is sent to logstash or Graylog2. Correlation can be done using _Tracking.RootRequestId.
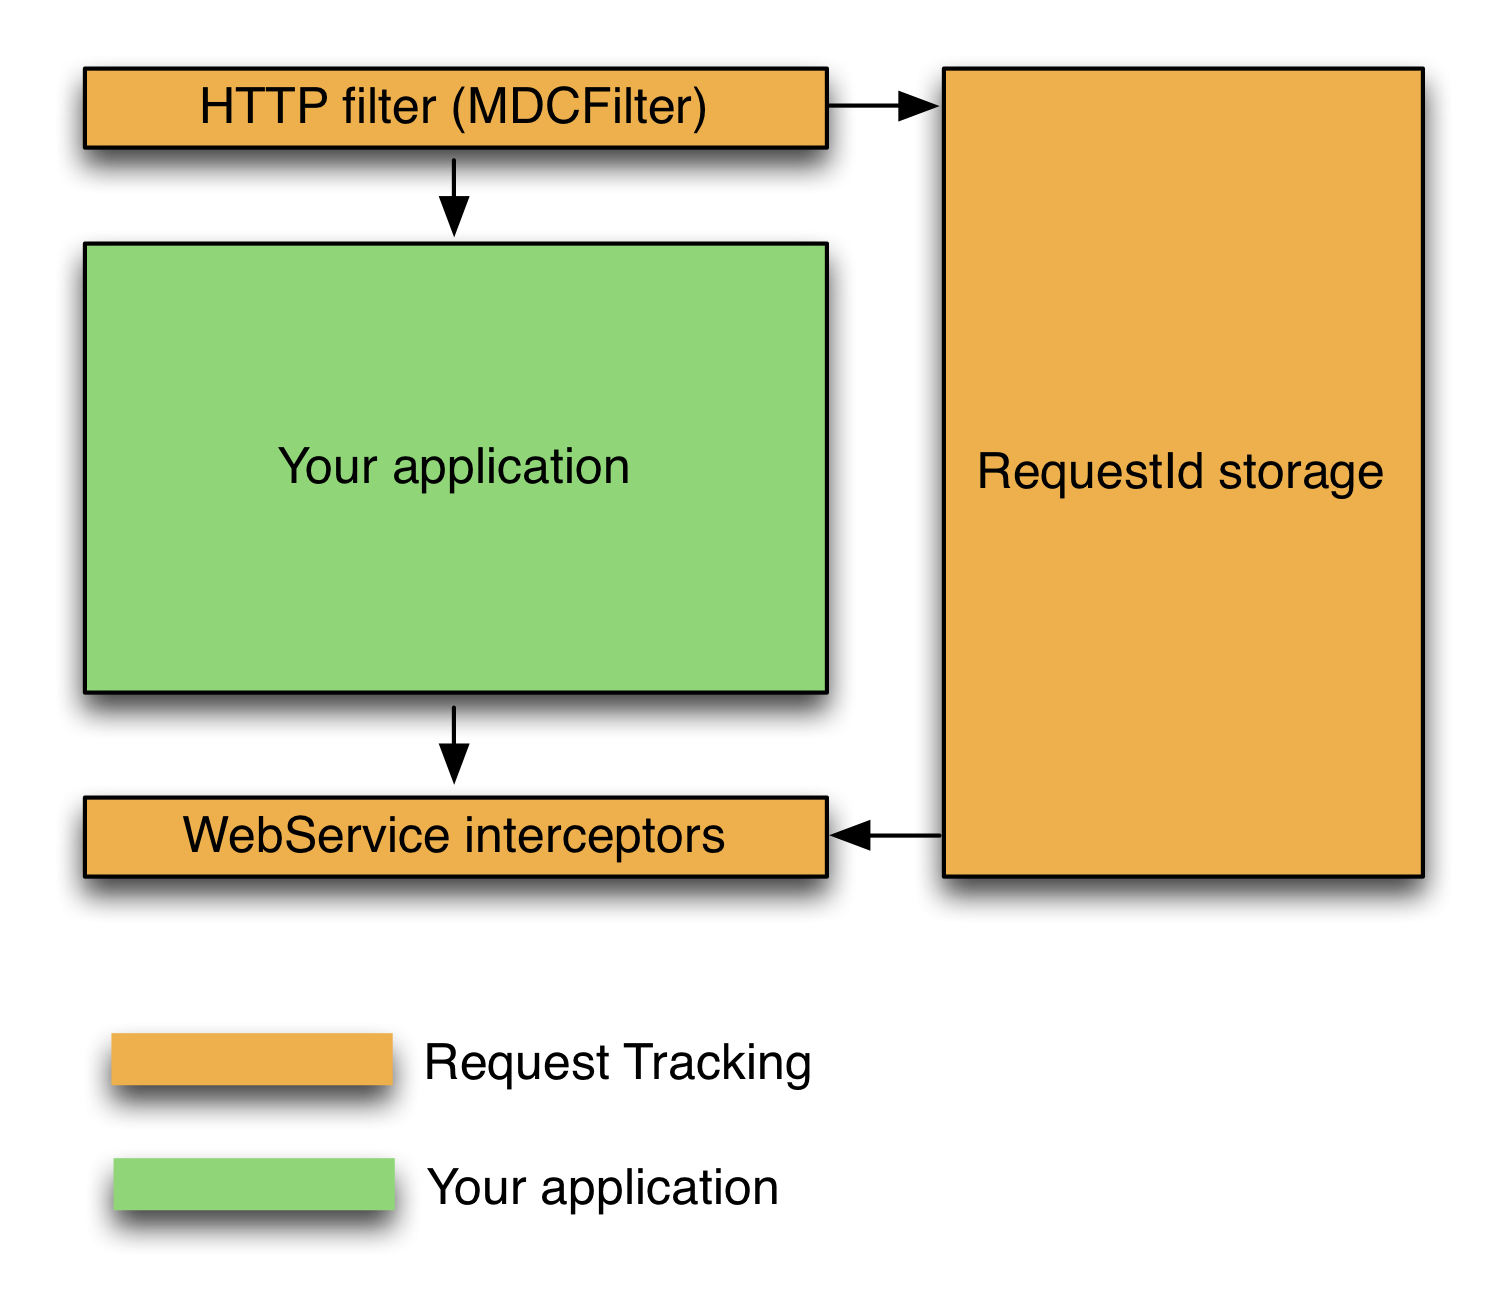
![]() The design is very simple: A HTTP filter in front of every HTTP service (that’s the same for frontend and backend) and request interceptors for REST/SOAP WebService clients.
The design is very simple: A HTTP filter in front of every HTTP service (that’s the same for frontend and backend) and request interceptors for REST/SOAP WebService clients.
HTTP filter: Creates a new request id or uses the passed request id and sets it into the MDC
Client interceptors: Use the request id and pass it towards the called service
This approach enables Java applications to track seamlessly every user request with minimal effort: You have to add the HTTP filter and inject the client interceptors.
Grab yourself the code at https://github.com/mp911de/central-logging-tracking-example and play around. There’s still a lot more possible to track what’s happened and to improve operations, but that’s out of scope for now.
Happy New Year!
